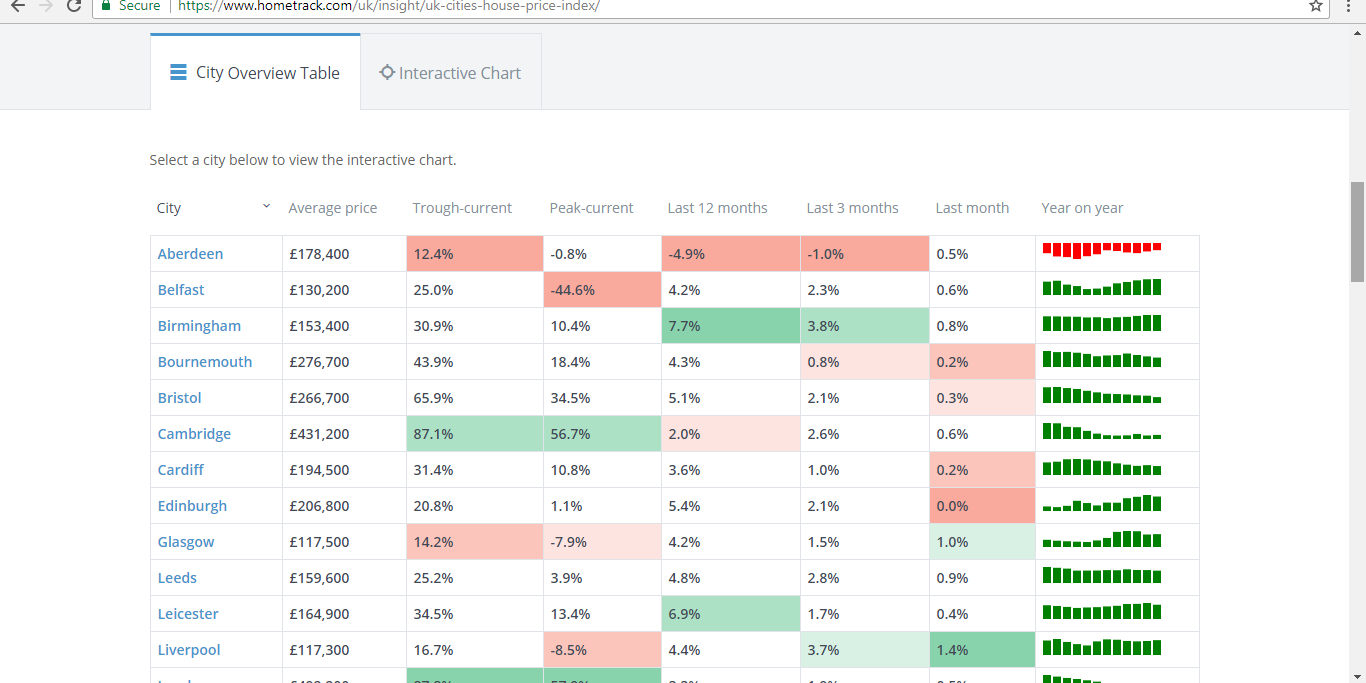
Ok, there’s a bit of artistic licence there but the Hometrack UK Cities House Price Index for July 2017 has just come out.
As I’ve said before, if you want to know what’s really happening in the UK market, and not rely on general stats and indices, this is the one to watch.
Hometrack are the real deal – their desk-top valuation algorithm is used by 80% of lenders (note that the number of lenders who use it, not the number of valuations they use it for) so they need to be pretty good at collecting the data.
Here’s the headlines from this month:
- UK city house price inflation at 5.3%, down from 7.4% in July 2016.
- Birmingham is the fastest growing city (8.0%) followed by Manchester (7.1%) and Nottingham (6.9%). Aberdeen price growth negative for exactly 2 years, house prices are 16% lower since 2014.
- The steep slowdown in London house price inflation has bottomed out with an increase in the annual rate of growth to 2.8%. Small price gains are being recorded against the backdrop of lower turnover.
Prospects for the remainder of 2017
There remains a clear divide between the prospects for house price growth in regional cities, where affordability levels are attractive, and the prospects for house price growth in London and other high value cities in southern England. We expect house price growth in regional cities to be sustained at current levels for the rest of 2017. London is set for a sustained period of low nominal house price growth and lower sales volumes.(my emphasis – Peter)
To read the whole report please click here, It’s well work a read.
One thing that strikes me when looking at the figures for individual cities is how pronounced the north/south divide is still. Quite a few northern cities are still below the 2007 peak, including Newcastle where I have quite a few properties, but by comparison Newcastle is doing quite well at just minus 4%!
In theory I would expect a jump at some point as the north closes the gap back to historic levels (there will always be a gap, but I would expect it to narrow).


