I’ve mentioned it before on this blog but the Hometrack City index is worth another look.
Not least because it’s monthly and coincidentally the latest results popped into my inbox this morning.
If you really want to know what’s happening with house process in the UK, and at a micro level, this is the index.
It’s true that Nationwide produce a quarterly index which looks at prices per region, but Hometrack go a step or two further to look at prices per city.
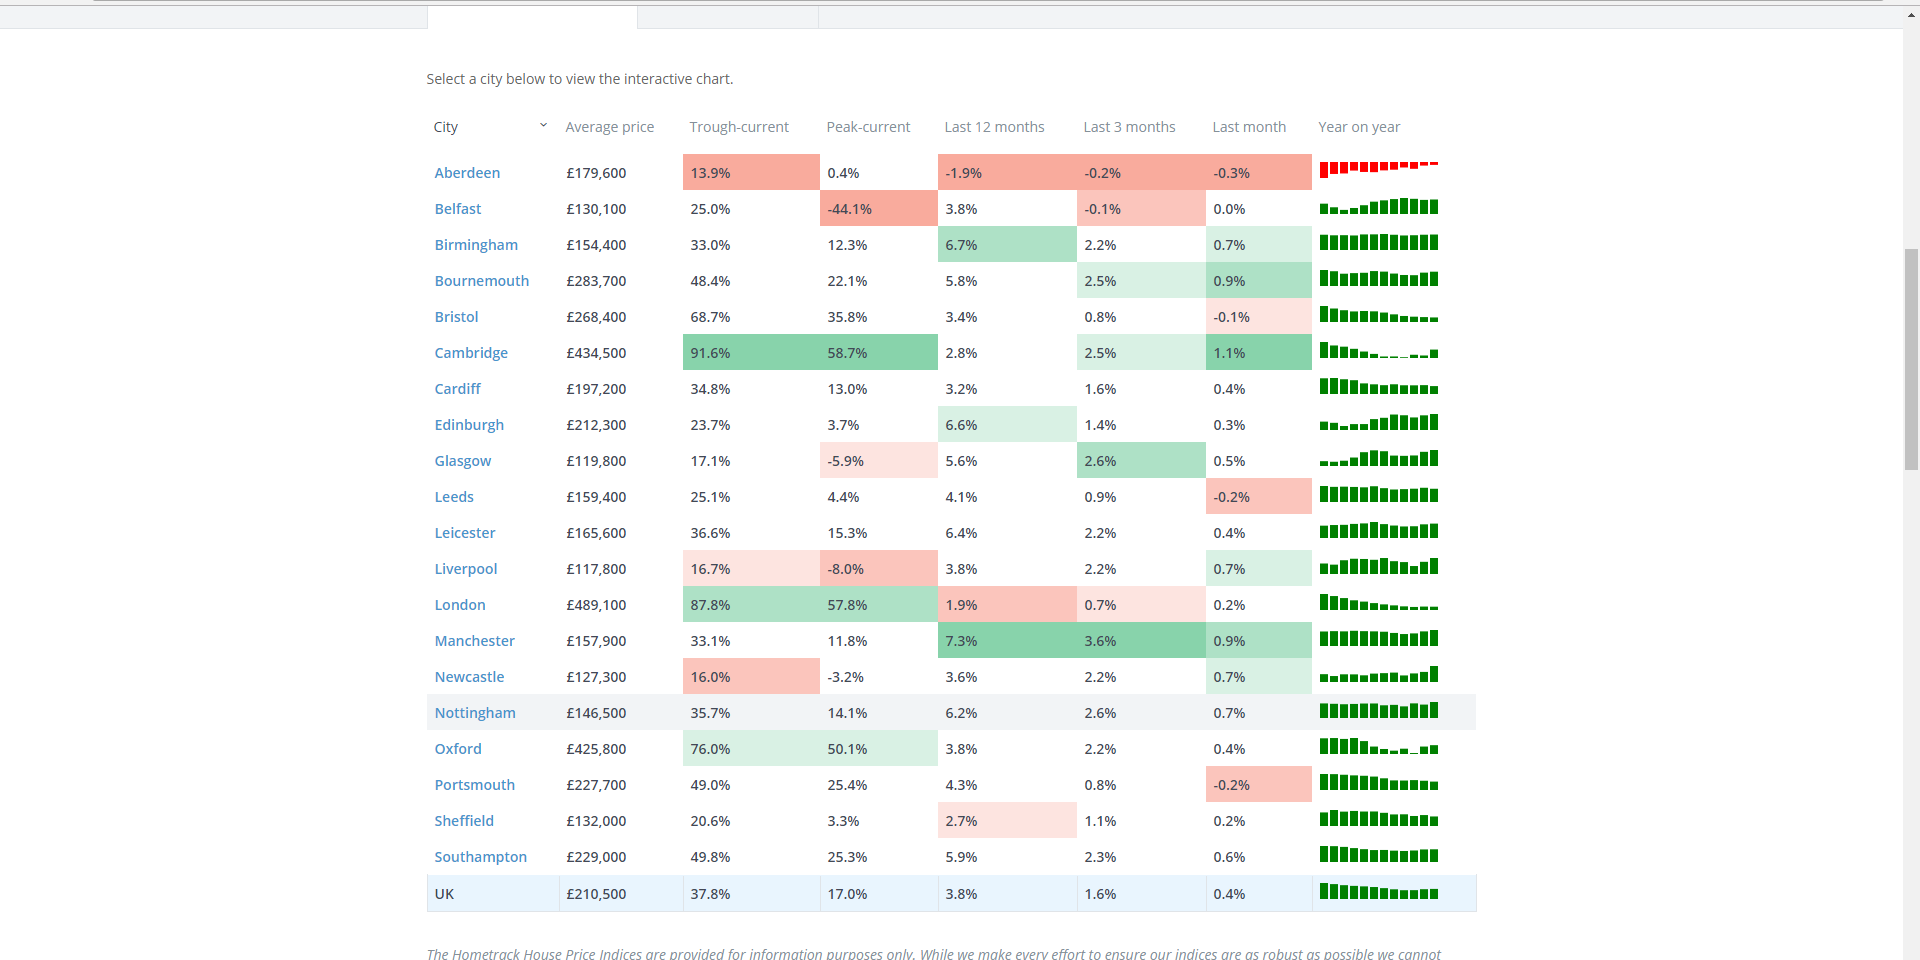
On the 20 City Index prices have increased in every month of the last 12 months in every city, except for Aberdeen, where prices have fallen in every month of the last 12 months.
So, on that measure, Aberdeen is the worst performing city in the UK.
(But of course that DOESN’T mean an investment in Aberdeen is a bad one – what about historic growth, current rents etc? And, of course, there is an argument that NOW is the time to buy in Aberdeen, depending on what price and terms you can agree).
Despite price rises in most cities (all except Aberdeen), several are still recovering from the 2007 crash and struggling to get any momentum in value increases. For example, values in Glasgow are still 6% down on the 2007 peak, and values in Newcastle are still about 4% down. Liverpool is still 8% down, and Belfast is a whopping 44% down.
If your news source is London-centric, it might surprise you that there are places where property prices are still BELOW the 2007 peak. Londoners are asking about when will the market will crash, whilst some of us are STILL waiting for the market to recover. Crazy world.
By contrast London is 58% above the peak, Oxford 50% above peak, Southampton and Portsmouth 25% above peak, and Nottingham and Leicester about 15% above the peak. Sheffield is 3% above peak. You can almost see the ripple. Clearly it’s arrived at Manchester and perhaps working its way further north to Newcastle?
Here are this months headlines:
- UK city house price inflation +4.9%.
- Manchester fastest growing city (7.3%). Upward price momentum in regional cities shows no sign of slowing.
- Real house price falls in London a drag on headline growth.
- Total value of homes across 20 UK city index exceeds £3trn.
- £2.4trn of housing equity across UK cities and a major opportunity for product innovation.
Anyway, I think the index is a great reference tool because it’s monthly, and it’s a proper index. Hometrack provide the algorithm (and data) that 80% of UK mortgage lenders use for desk-top valuations, so that suggests and implies care in the data gathering.
So if you want to know what’s happening where you invest, or if you want a tool to help you decide where to invest next, check it out.
Peter Jones B.Sc FRICS
Chartered Surveyor, author and property investor
PS. By the way, I’ve rewritten and updated my best selling ebook, The Successful Property Investor’s Strategy Workshop, which is an account of how I put together my multi-property portfolio, starting from scratch and with no money of my own, and how you can do the same. For more details please go to
thepropertyteacher.co.uk/the-successful-property-investors-strategy-workshop


